
Revenue, Wages, and Efficiency, Oh My! A Deeper Dive

“The job sounds great, but what’s the pay?”
Hear that? It’s a question entire generations have been taught not to ask.
But let’s be realistic. Pay is the bottom line. The make it or break it number. It’s what most employees are looking at when they accept a new job, despite studies that suggest they just want a ping-pong table and bottomless cups of coffee.
It’s definitely what most diesel technicians are looking at when they receive an offer.
By now, you know that we collected a lot of data for the 2022 version of the State of Heavy-Duty Repair report. For this article, we wanted to learn whether shop revenue impacts technician pay—and if so, by how much.
We’ve got some great charts and interesting data points to work through, so strap in and get ready to learn all about pay!
WHAT DO SUCCESSFUL SHOPS PAY THEIR TECHS?
The data we collected from internal and independent repair shops tells us the following:
The shops earning the least amount of revenue ($0 to $250,000 per year) paid their techs the least—an average of $53.78 per hour. That’s the lowest average we recorded. The wages go up with revenue, but not by as much as we thought they might, as shops making $1 to $2 million per year only paid their techs an average of $55.32 per hour.
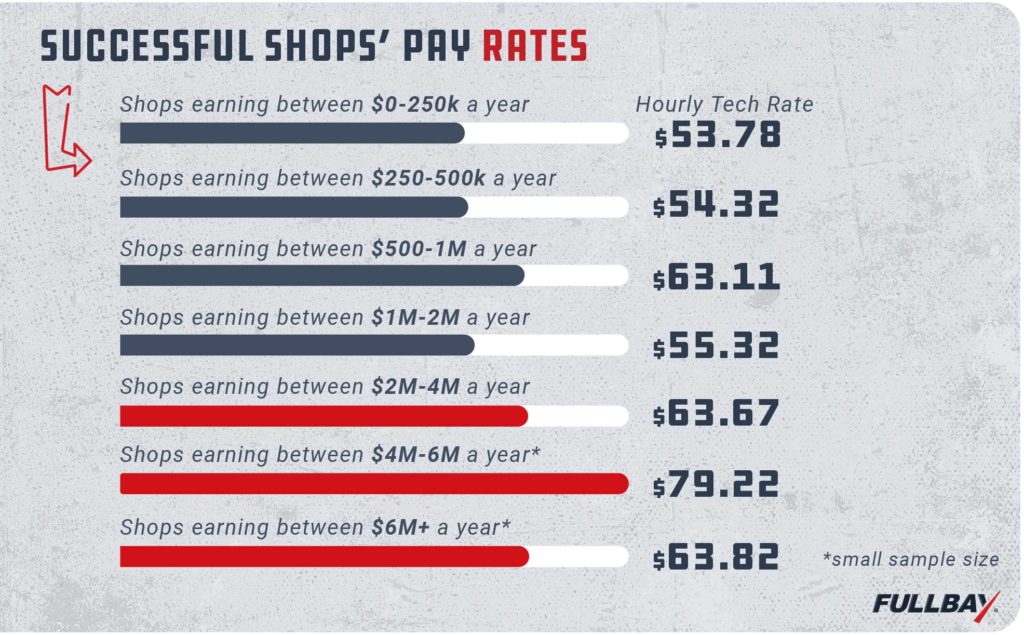
The real hourly jump comes from the shops making $2 to $4 million per year. They pay an average of $63.67 per hour
What do the really big guns pay? Keep in mind our sample data for this was pretty small, but from what we can see, shops that pull in $4 to $6 million a year pay an average $79.22 hourly rate.
In the words of Bill and Ted, whoa.
Oddly enough, that number takes a bit of a tumble at $6 million and up—that small sample size paid their techs an average of $63.82 per hour.
DOES SHOP AGE INFLUENCE PAY RATES?
The older they are, the more they pay…right?
(The correct answer to that is “Sometimes.” Or, more accurately, “It depends.”)
In looking at the ages of independent shops, we found that younger operations generally resided in the lower earning brackets, while older shops pulled in more. This isn’t entirely shocking; older shops have had a longer time to establish themselves and develop a customer base, as well as engage in more marketing.
- 38% of shops making $250,000 and under were 0-5 years of age. Shops that had been around for 20+ years were the second-highest, at 35%.
- 36% of shops making $250,000 to $500,000 were 0-5 years old. The runners-up in this bracket were shops that were 6-12 years old—34%.
- 44% of shops making $500,000 to $1 million were 0-5 years old. 32% of the shops in this bracket have been open for 6-12 years.
- 32% of shops making $1 to $2 million were 20 years old or more; 27% of shops in this bracket had been open for 6-12 years.
- 63% of shops making $2 to $4 million were 0-12 years old.
- 43% of shops making $4 to $6 million were 20 years or older.
- 42% of shops making $6 million or more had been open for 20+ years.
YEAH, BUT WHAT KIND OF RAISES DO THEY GIVE?
Money money money
Must be funny
In the diesel world
ABBA references aside, we looked at the revenue ranges of these shops and then examined the data we’d collected around raises. If you read the State of Heavy-Duty Repair, then you know more than 73% of the shops we surveyed gave their techs some kind of raise in 2021. The average jump was $13.88, but we dug into the data to break down average raise by shop revenue.
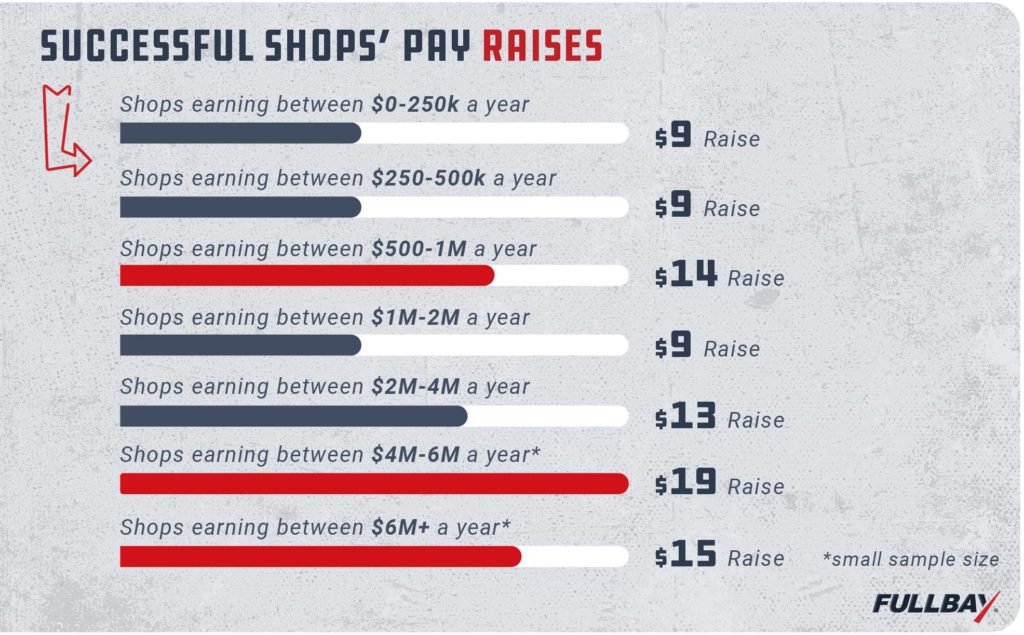
We’re curious about the $1 to $2-million earners, who seem to be giving lower raises than shops making more and less than them. Are they trimming costs, or perhaps intending to expand further?
NET PROFIT VS. REPORTED REVENUE RANGES
We took a look at the reported average net profit for a shop, then compared that to reported revenue ranges. Here’s what we discovered:
- $0 to $250,000
- 62% of shops reported a net profit ranging between 6-10%. Notably, though, 37% of shops in this range do not know their net profit
- $250,001 to $500,000
- 23% of shops reported a net profit ranging from 11-20%
- $500,001 – $1,000,000
- 32% reported that it was between 6-10%
- $1,000,001 – $2,000,000
- 24% of shops reported it being between 11-20%
- $2,000,001 – $4,000,000
- 32% of shops reported it being 11-20%
- $4,000,001 – $6,000,000
- 6-10% was reported 29% of the time for this range. Oddly, also reported that 29% of the time these shops did not know their net profit.
- $6,000,000+
- 42% of shops in this category report a 21-30% net profit
DO MORE EFFICIENT TECHS MEAN MORE REVENUE?
You all know how big we are on shop efficiency. We wanted to know if shops that measured and tracked how efficient their techs were had better monetary success.
The good news is more than half the shops we surveyed knew how efficient their technicians were. What we found even more interesting is that the data seems to suggest the higher-revenue shops tend to have a firm grasp on those metrics. The shops earning $6 million or more in a year led the pack—82% of them reported tracking technician efficiency.
Here are the complete stats, broken down (once again) by revenue category:
- $0 to $250,000: 67% of shops knew their technician efficiencies.
- $250,001 to $500,000: 68% of shops in this bracket knew their technician efficiency metrics.
- $500,001 to $1,000,000: 71% of shops knew their technician efficiency metrics.
- $1,000,001 to $2,000,000: 69% of shops knew their technician efficiency metrics.
- $2,000,001 to $4,000,000: 81% of shops knew their technician efficiency metrics.
- $4,000,001 to $6,000,000: 79% of shops knew their technician efficiency metrics.
- $6,000,000+: 82% of shops knew their technician efficiency metrics.
WHAT ABOUT THE TECHS?
Last, but certainly not least, we wondered if there was any sort of correlation between revenue and technicians knowing their own efficiency numbers. The highest-earning shops, following the general pattern we’ve seen in this data, made sure their techs knew their efficiency numbers.
In the $1-$2 million bracket, 64% of techs knew their efficiency. In the $2-$4 million bracket, 74% of techs knew their efficiency. Those are pretty solid numbers. Compare them to the percentage of techs in the $0-$250,000 bracket (42%) or the $500,000 to $1 million bracket (also only 42%).
MONEY MONEY MONEY
We’ll leave you with this thought: While a shop’s individual circumstances will largely dictate what it pays its techs, there appears to be a general correlation between things like technician efficiency and hourly wages. Together, these things contribute to a shop reaching those higher revenue brackets.
And yes, we know that there are many factors that impact a shop’s income. But we do feel those two factors in particular will play a big role for any shop that wants to go from “getting by” to “making it rain” (er, being highly profitable).
Which came first? It’s hard to tell. It’s something for us to look into in the next report.
Speaking of the report, if you haven’t checked it out already, click here to download your free copy of the State of Heavy-Duty Repair! It’s a fascinating snapshot of the diesel world (and its occupants) as it exists right now, and it’s full of interesting data. Grab your copy and enjoy—and we’ll see you on the next deeper dive!
Get news & tips Right in your inbox.
