
Reporting In: 5 Reports to Help You Boost Revenue in 2022

Let’s talk about reports.
No, not report cards (though we forgive you if that term sent a shudder down your spine). We’re talking about the reports you can generate with Fullbay that will give you critical information about your shop and what’s going on in it.
Are you not using reports yet? That’s okay. In the spirit of helping you improve your shop operations at this midpoint in 2022, we spoke with product marketer Louis Barrales to learn which reports helped customers track and increase their revenue.
Here are five Fullbay reports that every shop should be using.
THE REPORTS
All Revenue Report
If you want an overview of your shop’s financial position, this report is for you.
The All-Revenue Report breaks down all the revenue streams flowing into your shop. You can see things like how much money you’re actually generating, the amount of customers contributing, and the number of parts you sell. You can also see revenue per customer (on average), revenue per order, per service, and so on.
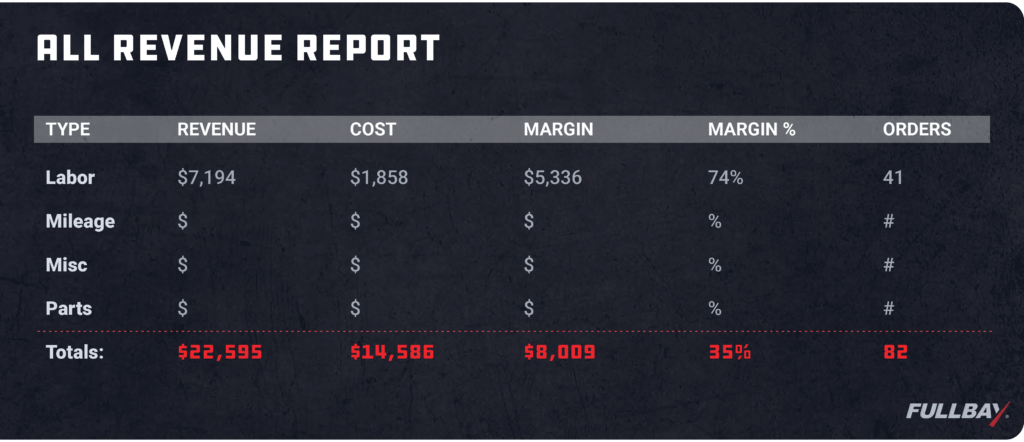
You can review your margins on this report: If you want a certain amount of income to come from parts or labor, for example, this is the report that will show you. You can also dive even deeper to review the individual performances of your employees.
A/R Aging Report
Are your customers paying you?
If they’re not…well…you have a problem.
The A/R Aging Report (A/R stands for Accounts Receivable) shows you which invoices are past due, and how far past due they are. Obviously, there’s a big difference between five days and three months – unfortunately, some clients take even longer to pay up.
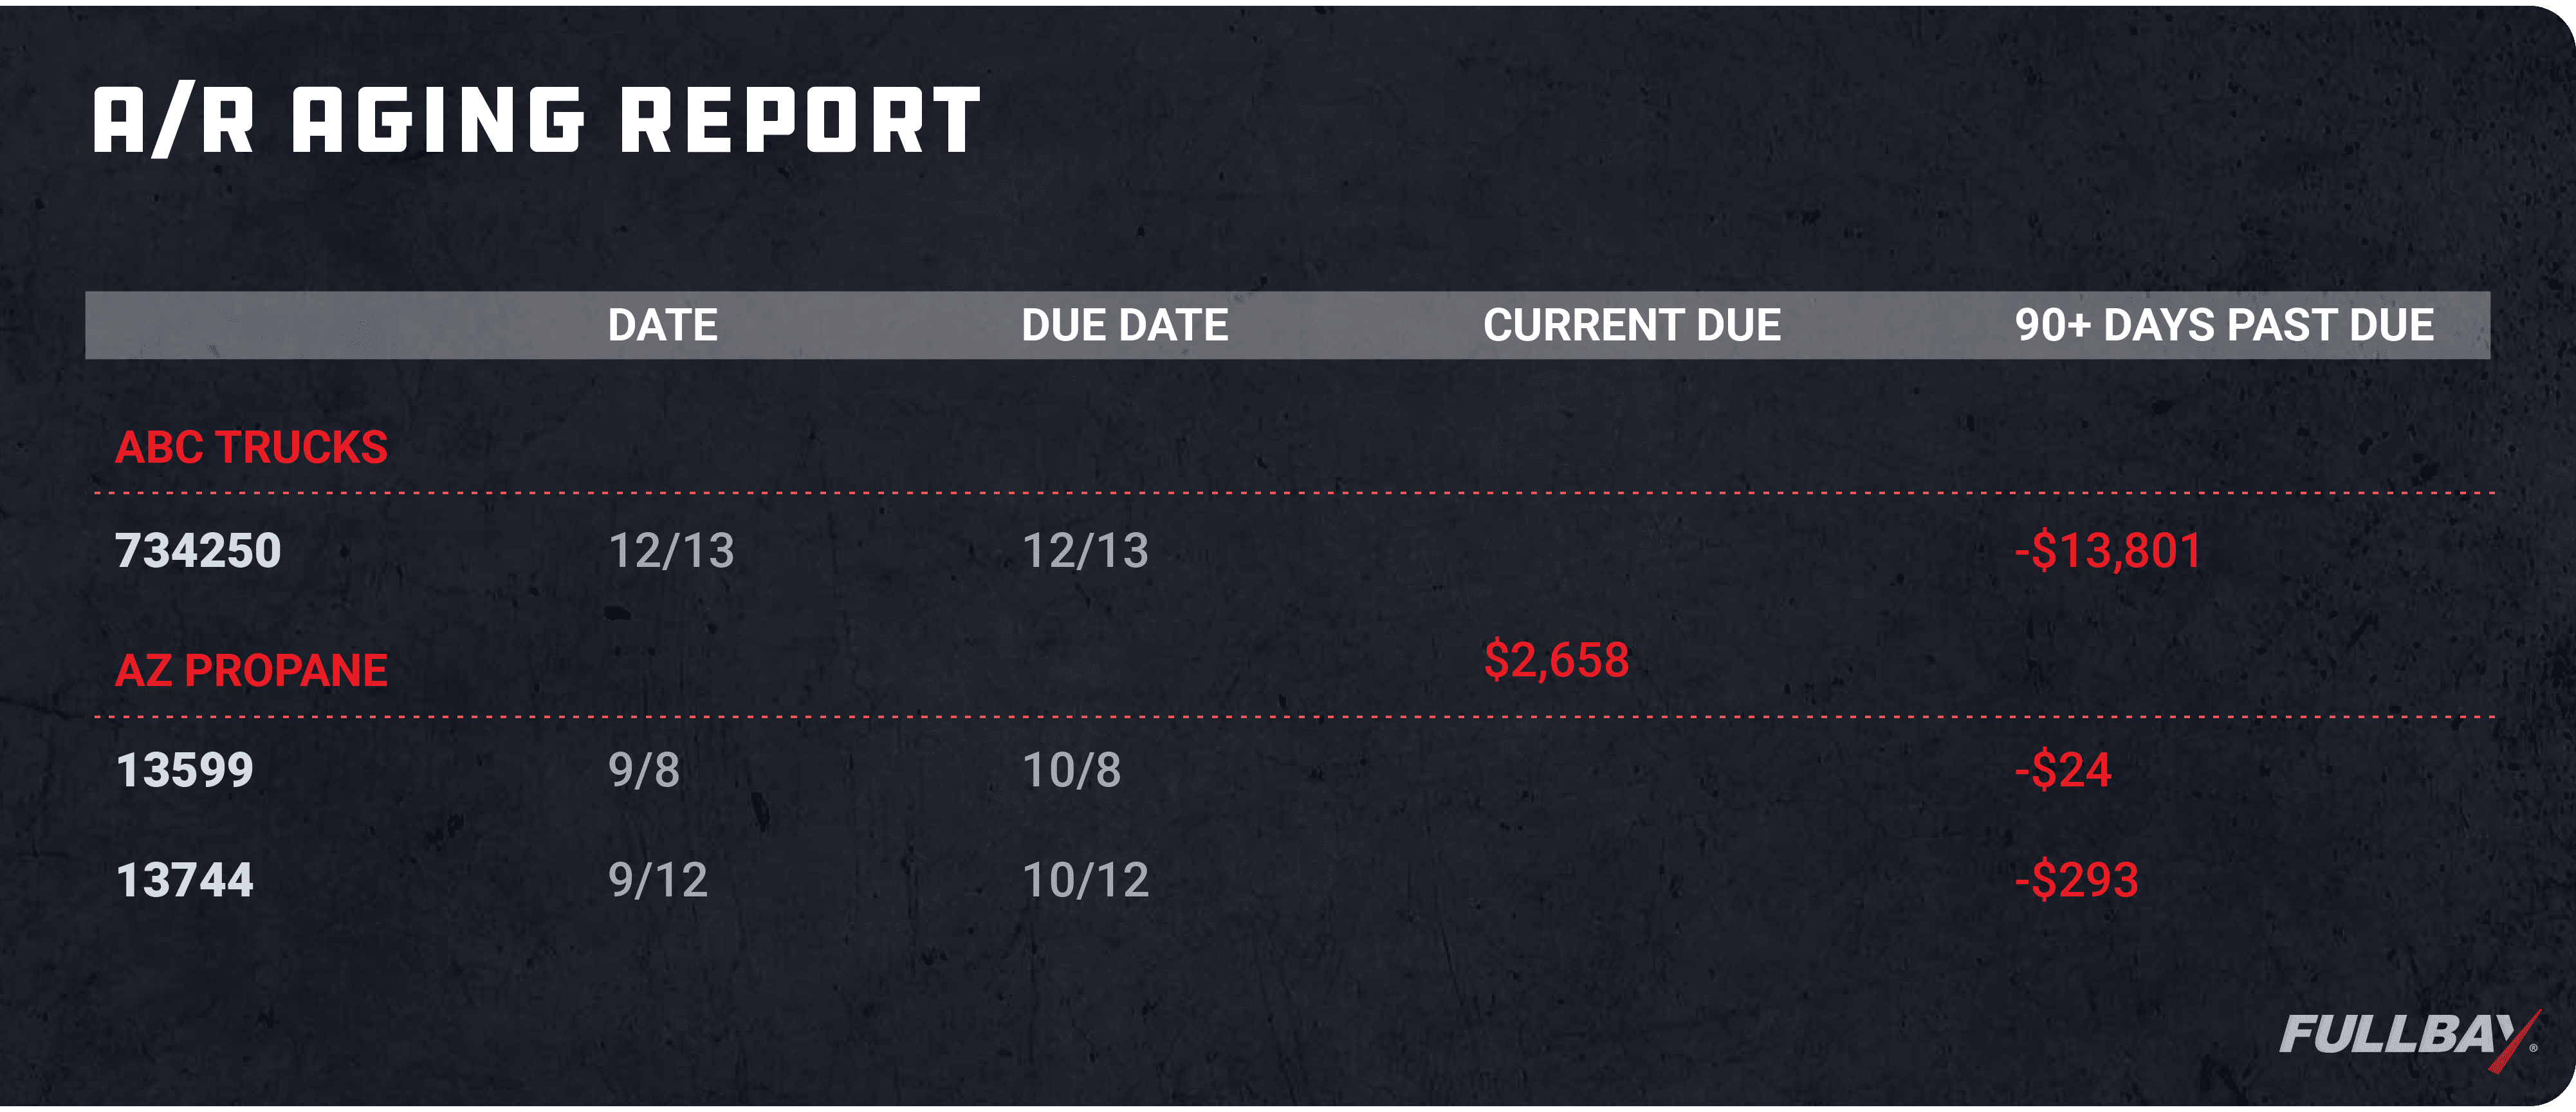
In the old days, you generally had to rustle through your records by hand to find out who hadn’t paid their bill. You might not even be keeping track of how much you were losing. The A/R Aging Report does that for you; you can see not only how much money a particular client owes you, but also how much money you’re owed overall.
It’s often a sobering sight, and it’s all the more reason to keep track of (and keep after) clients who are lagging in their bills.
Fleet Report
The Fleet Report is your sales engine.
We’re big fans of tracking PMs; when you stay on top of routine maintenance, your customer gets safer vehicles with less downtime, and your shop gets steady work.
When you or your service manager opens the Fleet Report, they can see all the PM work various trucks and fleets need. Inspections coming up? It’s in this report. Brake job overdue? Yep, it’s in this report.
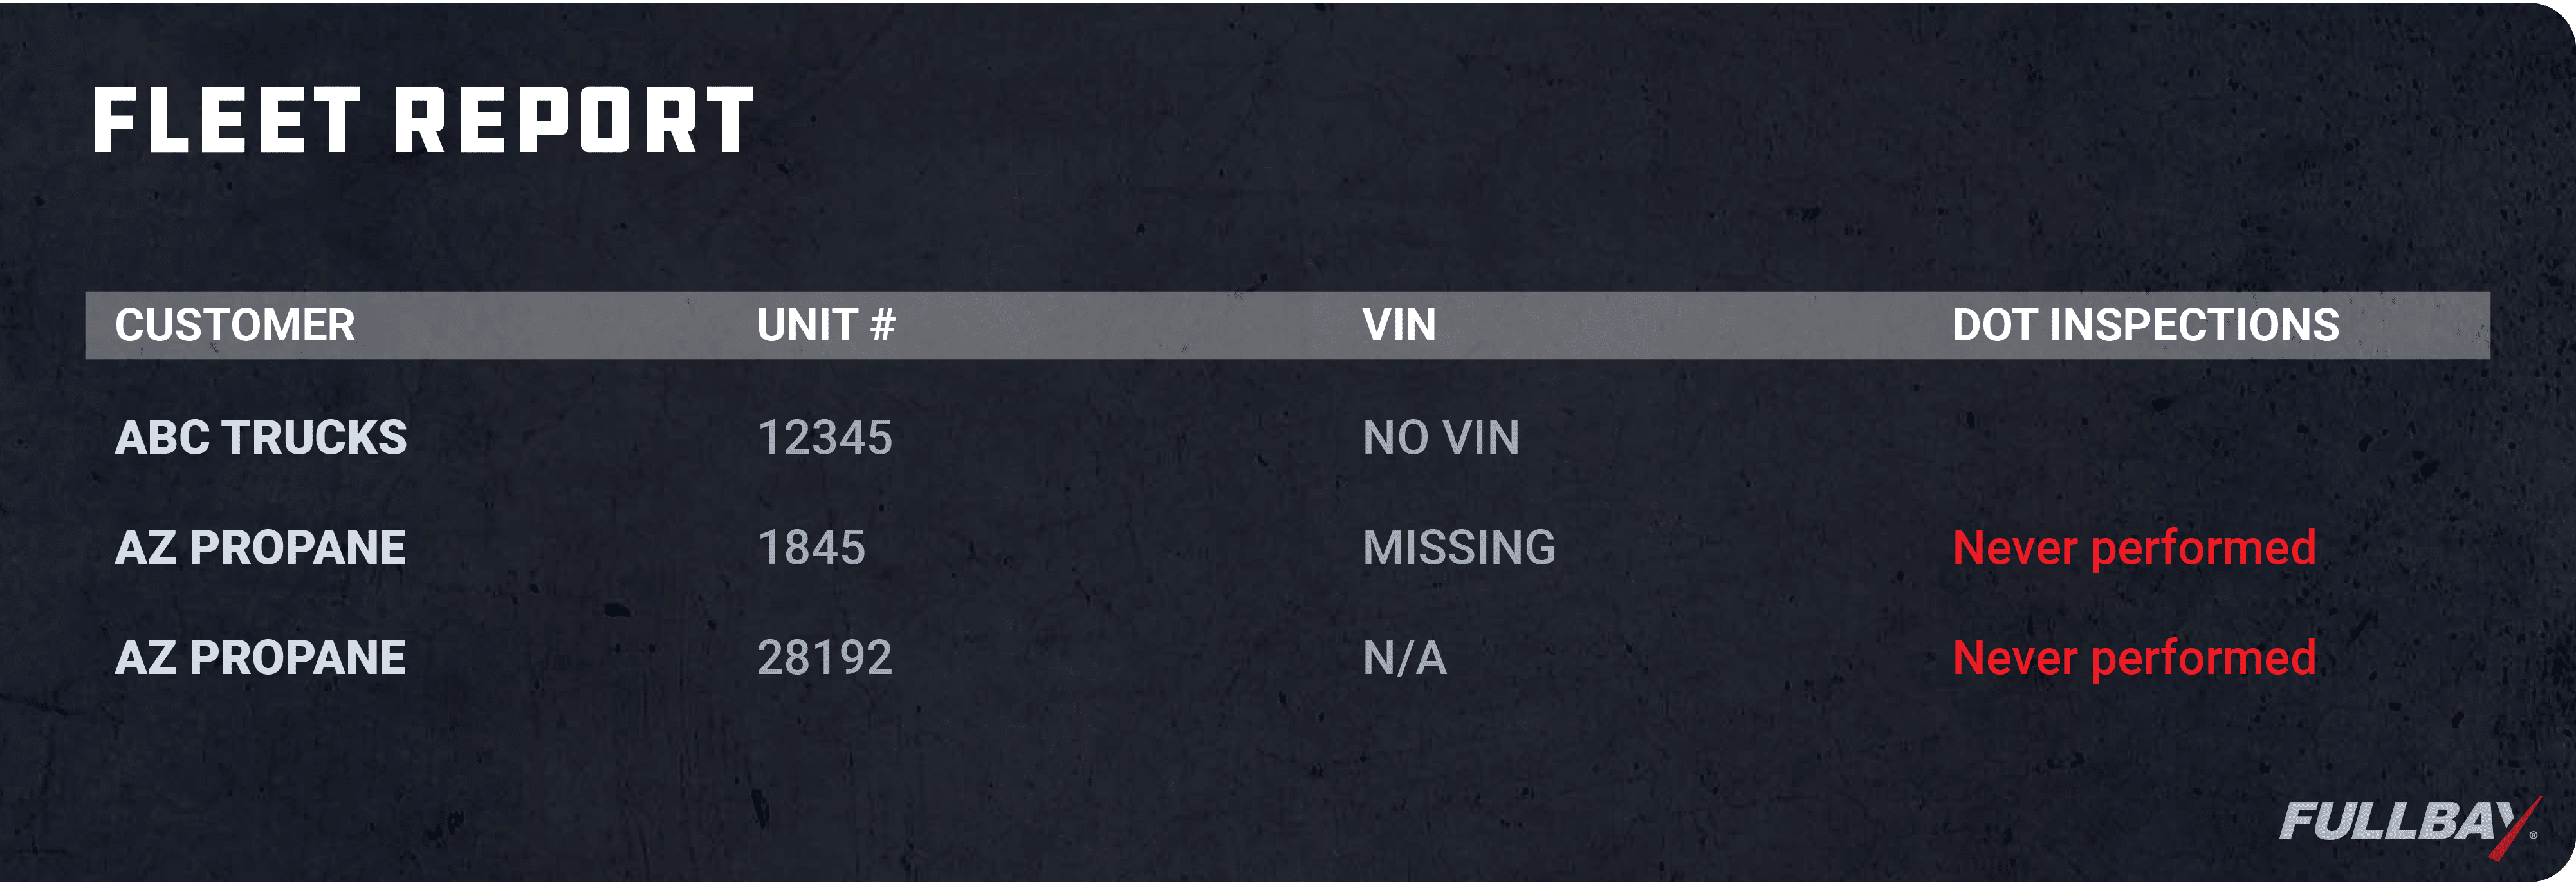
You can also review all upcoming PM work from this report, or you can dig down into specific customers to see what kind of work they have coming due (or, in some cases, what work is overdue).
Employee Statistics
We’re big on helping techs do their best work. That’s what the Employee Statistics list is for; you can see how your techs are doing, and from there determine what you can do to help them.
When you open this list, you’ll see Completed Hours, Clocked Hours, and Efficiency.
- Clocked Hours represent how long the tech is clocked in. As soon as they “punch in” at the shop in the mornings, this timer is running.
- Completed Hours represent how much work the tech has done on a service order. Once a service manager assigns them to a job and they begin the repair, that clock is running in the background.
- Efficiency is determined when the app figures out how many hours were spent repairing something vs. how many hours the employee is actually in the shop.
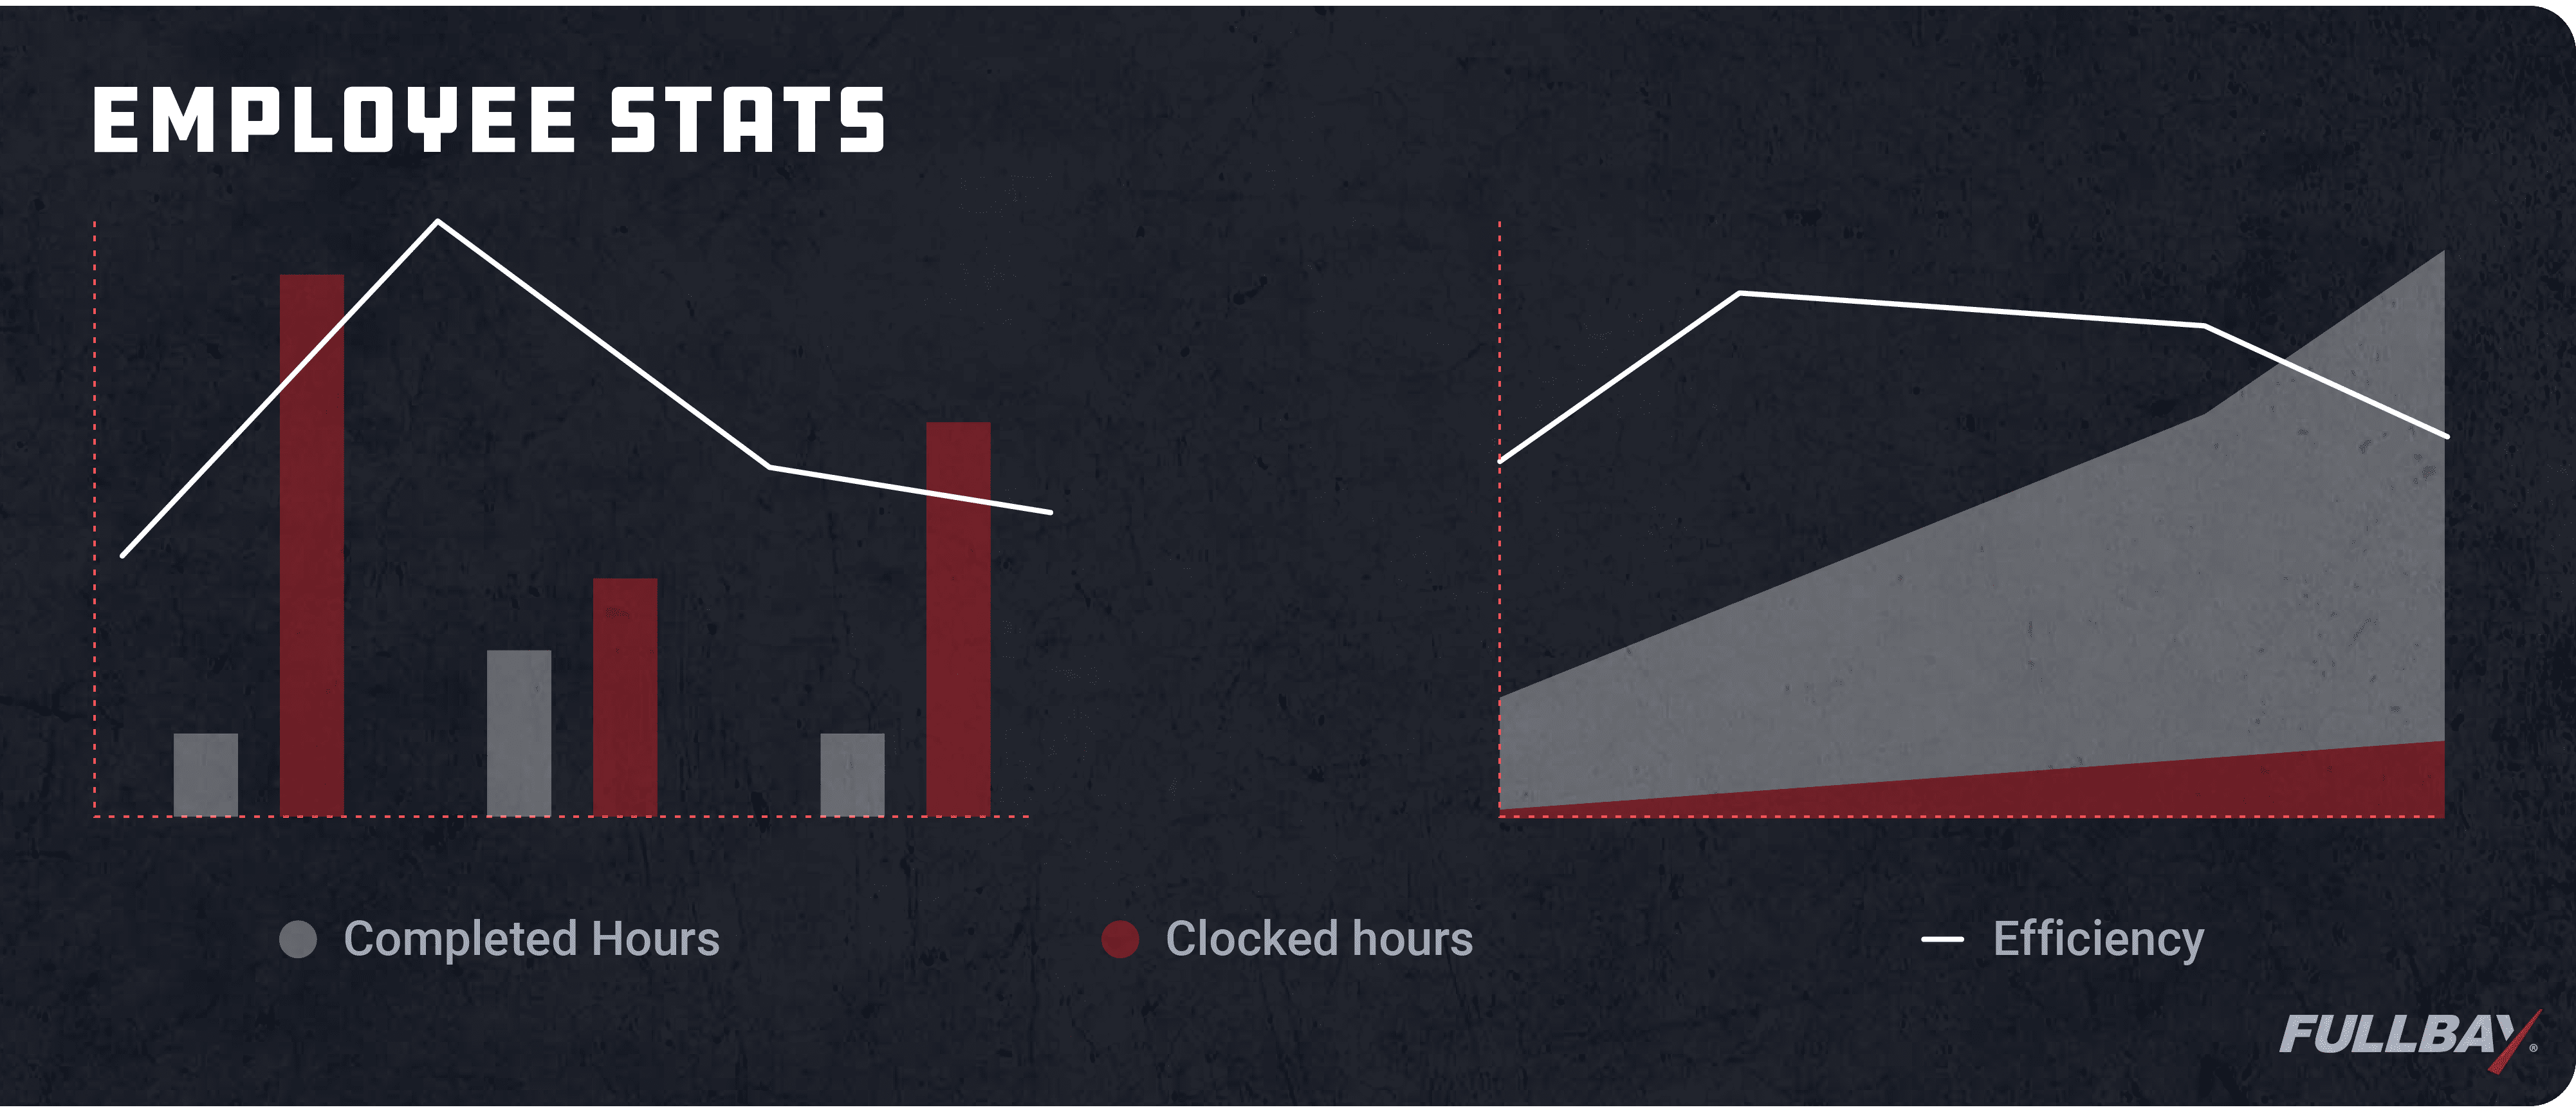
As an example, let’s say you have a technician who has 45 clocked hours in a week…but only 30 completed hours. It’s safe to say something is wrong there—you’re losing money with this tech.
Before your blood pressure rises any further, understand that this is not necessarily the tech’s fault.
The Employee Statistics report is particularly valuable when it comes to seeing where your techs may be having trouble. If someone has low hours, why is that? What can you, as an owner or manager, do to help? There may be road blocks you need to remove.
Alternatively, you may be overstaffed; you might have plenty of work for three techs, but not enough for five. And so on. Basically, the point of this report is to draw attention to problems your shop might be facing.
Inventory Velocity
How fast are you selling your parts, and are you stocking too many or too little? This report will answer that question, and will help you ensure the money you spend on inventory is fully maximized.
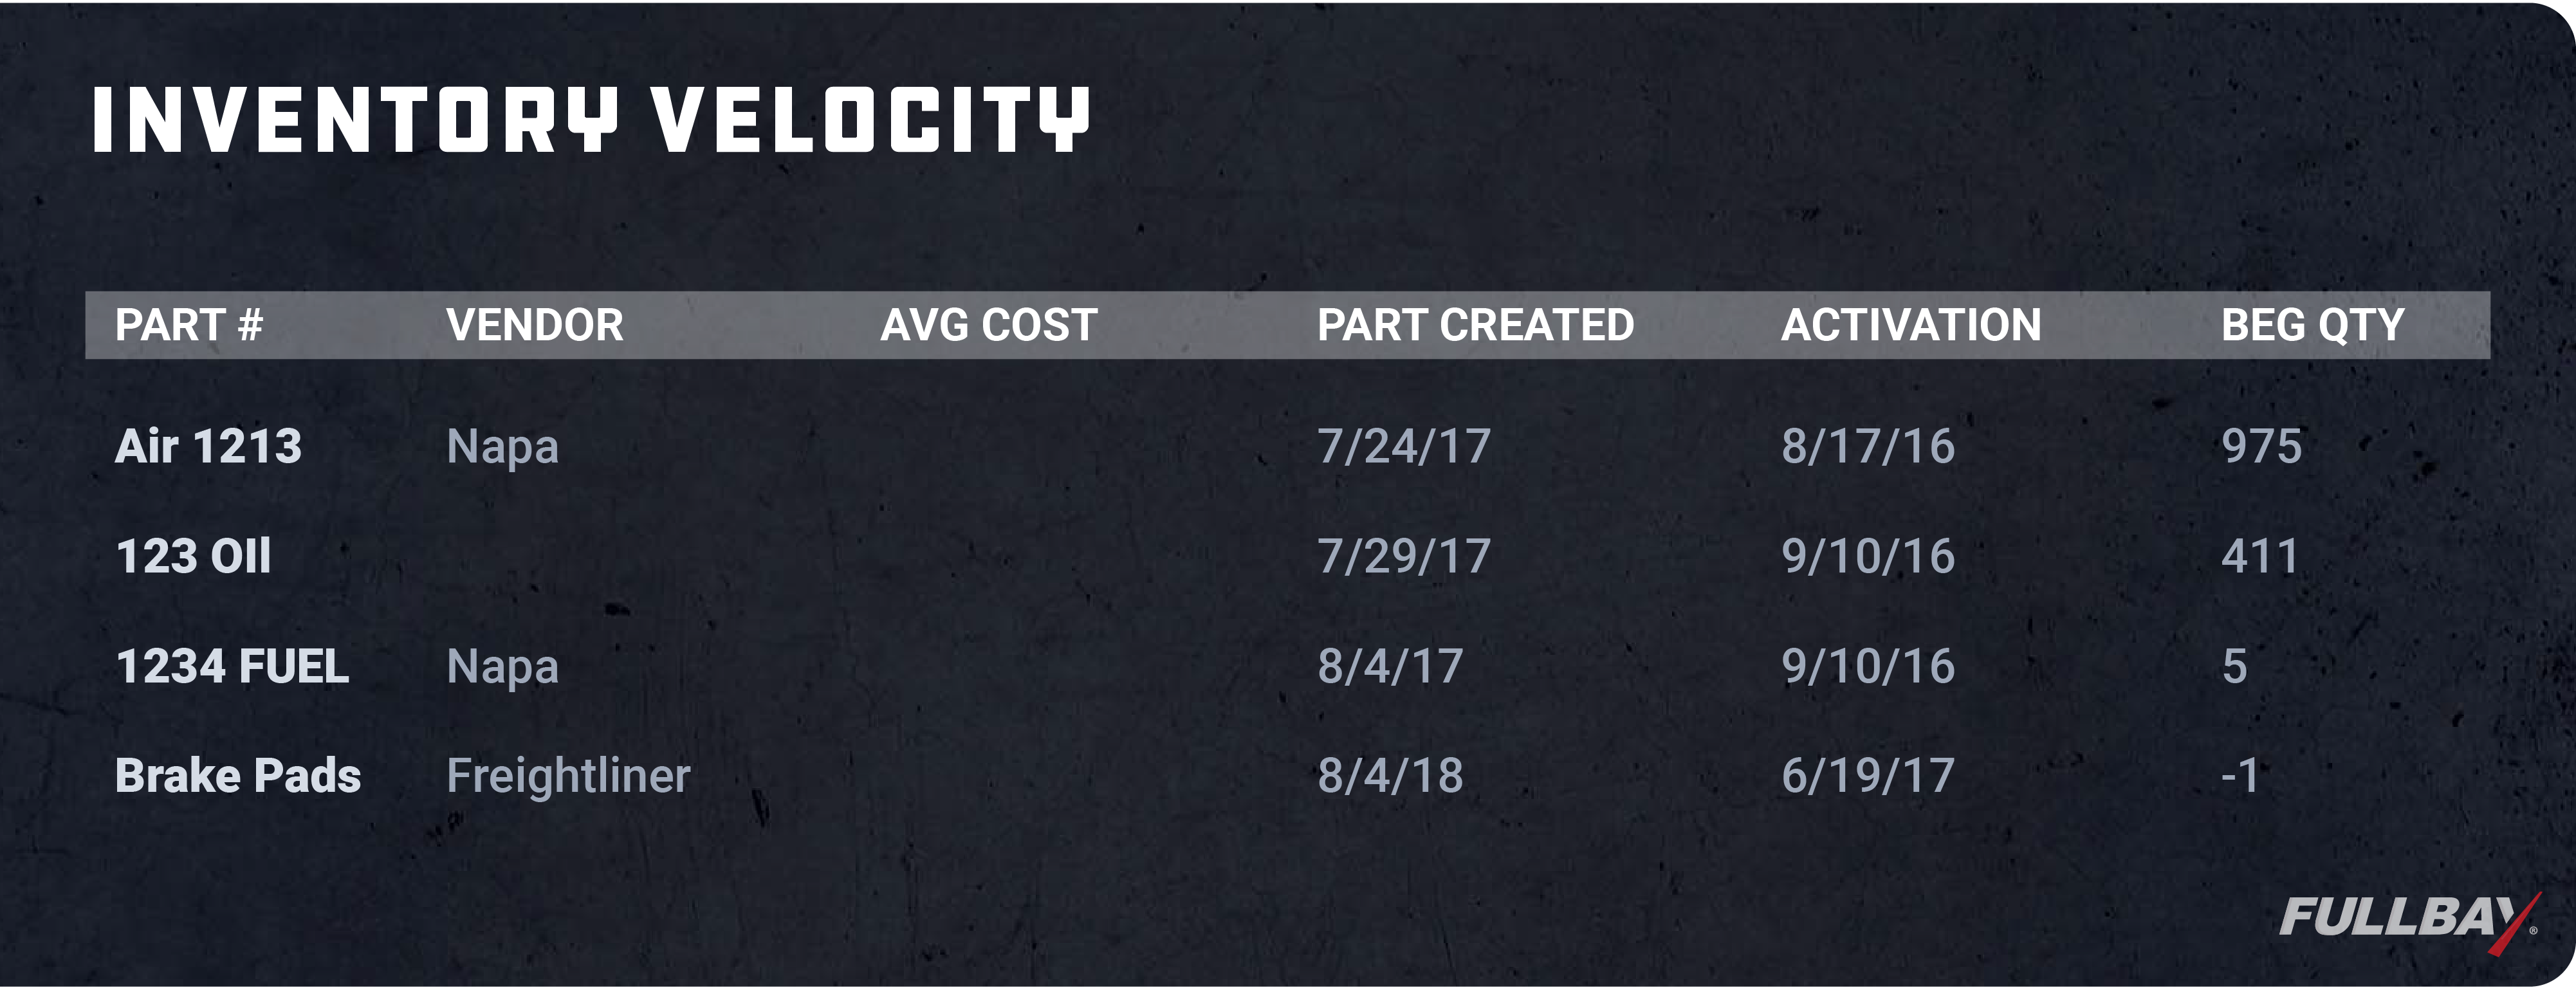
If you’re selling 16 glow plugs a month, but you keep 50 in stock at all times…that’s inventory you’re not selling. Thirty-four pieces of inventory, to be exact. If you’re constantly topping it off to 50, that’s a lot of extra glow plugs sitting in your parts room, slowly losing their value or even deteriorating over time. Several of our customers have completely revamped their inventory after adopting Fullbay, using it to purge parts they aren’t selling and stock up on the ones that they need.
The more inventory you have, the more you have to count. The Inventory Velocity Report cuts down on the amount of time you’re going to end up spending on cycle counts—which is a win for everyone.
SUMMING UP
Fullbay’s reports can make your life a lot easier—and show you the way to additional revenue. We hope you’ll give these a try.
If you don’t have Fullbay but are ready to see what it can do for you, get in touch with us! We’d love to walk you through our free product demonstration and get you on your way to a more productive 2022.
Get news & tips Right in your inbox.
