Repair Orders per Tech Joins Fullbay Insights
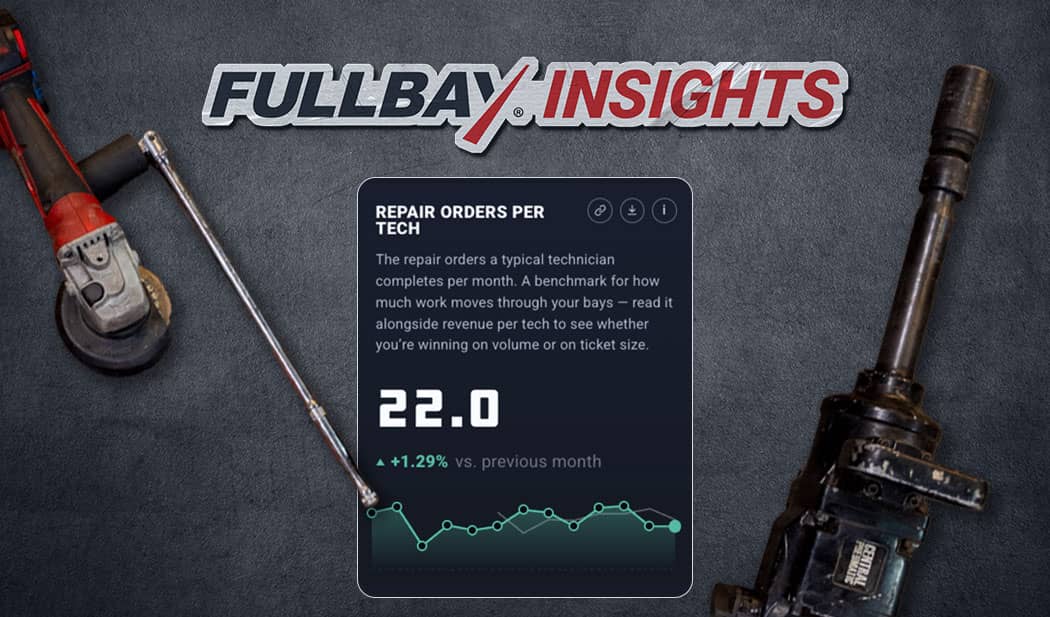
Fullbay Insights now has a fifth benchmark: Repair Orders per Tech. In September, the median Fullbay shop completed 22.0 repair orders per technician. The card also shows the previous 13 months, so you can compare the current benchmark with recent history.
What Repair Orders per Tech Shows for September
As stated, September’s median landed at 22.0 orders per tech, the same as August. The month-over-month card still shows a 1.29% increase because that comparison only includes shops that were active in both months.
Year over year, the median is down 5.98%, from 23.4 in September of 2025 to 22.0 this September. Across the full 13-month trend, repair orders per tech have ranged from 20.0 to 24.1, putting September right around the middle of the pack.
By the way, 22.0 isn’t an unusual result, as the median has hit that exact number four times in the last 13 months. One month doesn’t make a trend, though, so October’s data will help show whether the year-over-year gap is sticking around or just normal movement.
How to Read the Card
Start with the 13-month trend, because it gives you the bigger picture and helps show you whether the latest number is part of a longer pattern or just a monthly fluctuation. For example, Repair Orders per Tech fell to 20.0 in November of 2025 before climbing back to 23.7 by March of 2026.
Next, look at the month-over-month change. That percentage only compares shops that were active in both months, so it may not match the difference between the two headline medians. Tech Efficiency, for example, moved from 108.7% in August to 109.1% in September, while the card shows a 0.02% monthly change. Both figures are correct; they’re just answering slightly different questions.
Finally, look at where the latest result falls within the recent range. September’s 22.0 is near the middle of the 13-month trend, so the monthly and yearly changes are the most useful for showing direction, not for labeling the number particularly high or low.
Checking Your Own Shop
Your shop probably won’t match the industry median exactly, and that’s OK. The more useful comparison is how your own trend moves alongside the benchmark. Track your repair orders per tech the same way each month. Use the same counting rules every time, so you’re comparing apples to apples.
Then look at six months of data, or all 13 if you have it. If your results rise and fall at roughly the same times as the benchmark, broader seasonal or industry factors may be playing a role. If your shop dips when the benchmark stays relatively steady, that’s a good reason to dig into what may have changed internally.
The goal is to understand what’s driving your own trend.
The Other Four Benchmarks
- Revenue per Tech finished at $33,912, up 1.42% from August and 4.74% year over year. Over the 13-month trend, it ranged from $29,108 in November of 2025 to $35,198 in July of 2026.
- Billable Hours per Tech reached 127.1, or 28.9 hours per week, up 2.68% from August. The 13-month high was 130.3 in October of 2025, and the low was 117.3 the following month.
- Tech Efficiency held at 109.1%, up 0.02% month over month and 1.39% from September of 2025. It ranged from 106.4% in December of 2025 to 109.4% in July of 2026.
- Effective Labor Rate came in at $140.67, down 0.09% from August but up 3.62% year over year. The 13-month range runs from $135.36 in November of 2025 to $141.42 in August of 2026.
Questions Shop Owners Ask
What Counts as a Qualifying Shop?
The figures include only full-time techs, meaning 30 or more clocked hours a week, at shops with two or more techs.
How Often Does Fullbay Insights Update?
Fullbay Insights updates monthly, and each update refreshes every card and its 13-month trend.
Why Don’t Some Earlier Numbers Match What I Saw Before?
We added more shops to the data, which made the output more accurate, but did shift the numbers slightly. The page as it stands today is the one to use.
Read These Numbers Carefully
Fullbay Insights benchmarks are meant to provide context, not targets. Your shop’s results will depend on your market, customer base, staffing, mix of work, and other factors, so don’t treat the median as a number you’re supposed to hit.
Instead, use the benchmarks to spot trends and raise questions about your own operation. If something stands out, dig into your shop’s data before making changes.
You can find all five benchmarks and their 13-month trends on the Fullbay Insights page, where you can also subscribe for updates as new benchmarks are added. If you’re new to Insights, Meet Fullbay Insights explains how the benchmarks are calculated.
Because the data can update after this article is published, check the Insights page for the latest numbers.


Get news & tips right in your inbox.