Revenue Per Tech is up 3.12%: Meet Fullbay Insights
Summary
Fullbay Insights gives you a monthly look at real performance benchmarks from Fullbay-powered shops, so you can see how your operation compares and keep an eye on industry trends.
You’ll learn:
- Which shop performance metrics Fullbay Insights tracks right now.
- How the monthly benchmarks are collected and updated.
- What’s coming next for Fullbay Insights.
Hear ye, hear ye! We’ve got something exciting to announce.
We know, Fullbay, you might be saying. Fullbay Next is here. The greatest software for mobile-only and smaller shops ever! You’ve been talking about nothing else!
First of all, we’re thrilled with Fullbay Next, and we will keep on talking it up because it is awesome. But secondly, this article is not about Fullbay Next. It is about Fullbay Insights, and if you ever wondered how your shop stacked up against other Fullbay-powered operations…you’re gonna wanna read this.
What Is Fullbay Insights?
Fullbay has spent years collecting and publishing industry benchmarks in the State of Heavy-Duty Repair (read the latest edition for free here!). And that’s pretty cool. But it’s a once-a-year thing, and numbers…well, numbers can fluctuate quite a bit throughout a year, can’t they?
Your revenue per tech, for example, is $30,000 per month. OK, but is that good? How are other shops doing?
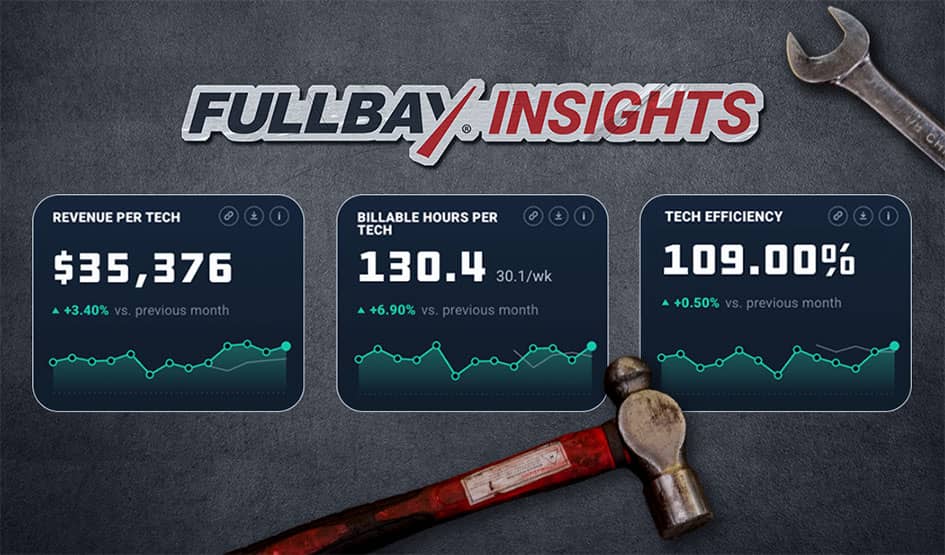
Fullbay Insights pulls real shop performance benchmarks from Fullbay-powered shops. You can take a look at the Insights page right now and see that average revenue per technician is $36,481 per month, an increase of 3.12% over last month.
We chose revenue per technician as one of three starting metrics after interviewing shop owners about which benchmarks they’d find most helpful. The other metrics available right now are billable hours per tech (129.7 hours; down 0.54% from last month) and tech efficiency (109.22%, or an increase of 0.20% from last month). Again, these are all numbers pulled from shops that run on Fullbay.
Why Is Fullbay Insights So Cool?
For starters, it shows you exactly how you stack up to other Fullbay-powered shops. The data is updated roughly the third week of each month, which gives shops time to finish and close out work orders from the prior month so the snapshot is complete. Fullbay then cleans up, anonymizes, and aggregates the data before publishing it.
The insights give you a way to see how your shop is doing alongside others. If you’re doing better, hey, good for you! If you’re trailing, well, you’ve got some work to do.
This data, by the way, is meant to be shared. That’s why it’s available on a public page and not locked in a vault guarded by an exhaust-breathing dragon. Each metric can be downloaded, making it easy for shops, consultants, publications, and other industry folks to reference current heavy-duty repair benchmarks without having to head to our page (but of course, we welcome you to visit us anytime you like).
More Is On The Way
Fullbay Insights is set to become even more insightful, as we’ll be adding one new metric per month for the next several months. We also have additional plans that will help Insights deliver even more value to shops and the industry, but we can’t quite reveal those yet. So, in the spirit of cliffhangers everywhere, please stay tuned.
In the meantime, feel free to browse the Insights we have available now. And if you’re new to Fullbay, why not learn more about Fullbay Next and what it can do for your shop?


Get news & tips right in your inbox.