
Effective Labor Rate Joins Fullbay Insights at $141.80
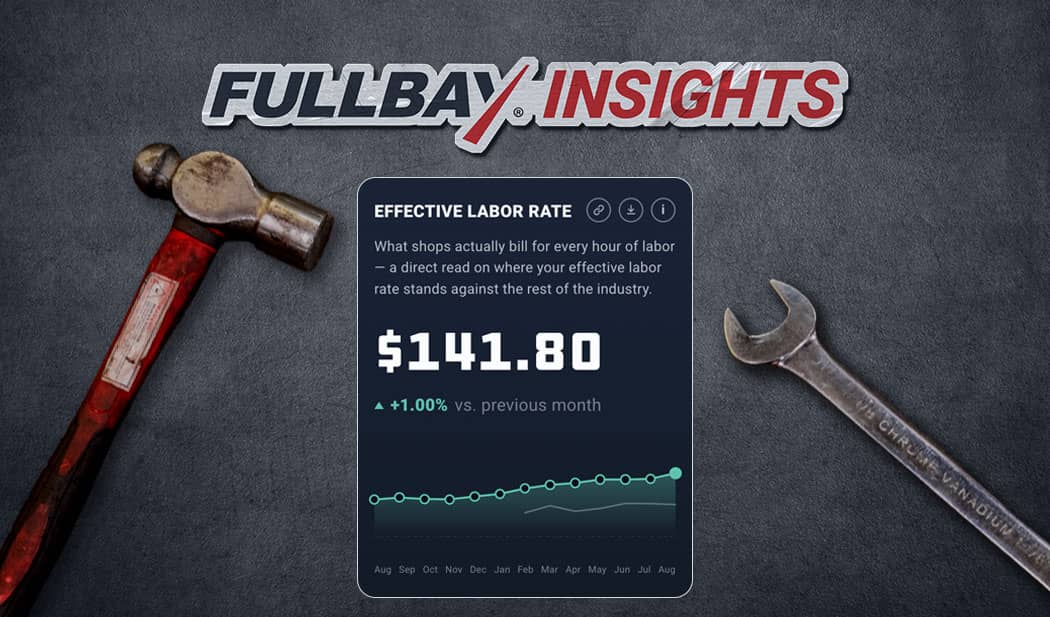
Fullbay Insights picked up a fourth benchmark this month. Effective Labor Rate tracks what shops actually bill for every hour of labor, and the August reading is $141.80.
That is not a posted rate. It is what came off the invoices. For each repair order, it is labor revenue divided by billed labor hours, averaged across a shop’s invoices for the month. The published figure is the median of those shop averages. Plenty of shops have a number on the wall and a different number in the accounting system. This metric reports the second one.
Effective Labor Rate
August came in at $141.80. That is the highest reading in the 13 months on display, up 1.00% from July and 4.85% from a year ago.
What matters more than August’s number is the trend behind it. Rates climbed in nine of the last 12 months, and on the three months it slipped, it never dropped by more than a few cents. August’s gain is the biggest of the lot. Shops have been nudging this number up in small steps for more than a year, and they have barely given any of it back.
A note on which shops actually count toward this number: shops running two or more full-time technicians at 30 or more clocked hours per week. Shops with almost no billed labor are out, as are shops billing a nominal non-commercial rate and records with clear data errors.
If you want to work on your own figure, our breakdown of what actually goes into setting a labor rate is still the most useful thing we have written on it, and the shop labor rate calculator will run the arithmetic for you.
Tech Efficiency
Tech Efficiency came in at 106.60% for August, down 2.40% from July.
That is the second-lowest reading in the current window, above only December 2025 at 106.40%. The drop from July is also the steepest one-month decline the window contains, roughly double the next closest.
Efficiency is also down 0.47% from a year ago. Small, but a purely seasonal August would leave the year-over-year line flat, and last August came in at 107.10%.
The metric divides billed labor hours by the hours technicians actually clock onto jobs. Readings above 100% are normal. A tech billing 60 hours against 40 clocked hours is running at 150%.
Worth a look if you are chasing your own number: our breakdown of what technician utilization reports reveal and the guide to boosting technician efficiency.
Revenue per Tech
Revenue per Tech finished August at $35,430, down 2.88% from July. July’s $36,481 is the top of the current window, so a step back was always the likelier outcome.
The year-over-year line is the one to watch. August sits 10.66% above August 2025. That is the third straight month in that territory, after June and July both cleared 10.90%. So a median shop is producing roughly a tenth more revenue per technician than it was a year ago, and it has held there all summer.
Billable Hours per Tech
Billable Hours per Tech came in at 126 for August, down 2.85% month over month and up 1.04% year over year. At 126, the monthly figure sits sixth among the 13 months on display.
The weekly number points the other way, and the calendar is the reason. August had 21 weekdays, while July had 23. Put both months on a standard five-day week, and August reads 30.0 hours against July’s 28.2, so a typical tech billed more per working day in August even though the month’s total came in lower. Anyone comparing their own August against their July should do it per working day.
How to Read These Against Your Own Numbers
One caution before you start comparing. Each metric’s median is drawn from the shops that qualified for that metric in that month, and the qualifying set is not the same from one metric to the next. Just because efficiency dipped the same month rates went up doesn’t mean the two are connected. This data can’t tell you either way. Read each line on its own terms.
Treat all of this as context rather than a verdict on your shop. These are medians across whichever shops qualified in a given month. They are not targets, they are not a standard anyone is holding you to, and they are not tuned to your market, your mix of work, or your customer base. A shop sitting well below one of these numbers may be doing exactly the right thing for where it operates, and a shop sitting above one may still have problems these four metrics cannot see. Use them to raise questions internally rather than to settle them, and check your own records before you act on anything here.
With that said, the practical move is to pull your own August figures and set them beside these four. If your effective rate is well under $141.80, the question is whether that is a posted-rate problem or a discounting-and-write-off problem, and those have different fixes. If your efficiency held above 108% while the median fell to 106.60%, you had a better month than most shops on the platform.
All four metrics update monthly on Fullbay Insights, with the trailing 13 months visible alongside month-over-month and year-over-year comparisons. September data posts next month.


Get news & tips right in your inbox.
